Stock Report Template Excel
Keeping a close eye on your stock portfolio is crucial for informed decision-making and maximizing returns. Manually tracking your investments can be time-consuming and prone to errors. That’s where a stock report template in Excel comes in handy. A well-designed template automates the process, providing you with a clear, organized overview of your holdings and performance.
This post will explore the benefits of using a stock report template in Excel and highlight essential features to look for. We’ll also delve into how to create your own customized template and provide links to readily available, free options to get you started. Ultimately, using a stock report template empowers you to take control of your investments and make data-driven decisions.
Benefits of Using a Stock Report Template in Excel
A stock report template streamlines your investment tracking process, offering several advantages:
- Organization: Consolidates all your stock information into a single, easily accessible document.
- Automation: Simplifies data entry with pre-defined fields and formulas for calculations.
- Performance Tracking: Automatically calculates gains, losses, and overall portfolio performance.
- Informed Decisions: Provides a clear overview of your investments, enabling data-driven decisions.
- Time Savings: Eliminates the need for manual calculations and data aggregation.
- Error Reduction: Minimizes the risk of errors associated with manual data entry.
- Customization: Allows you to tailor the template to your specific investment needs and preferences.
- Accessibility: Excel is widely available, making the template accessible on various devices.
Key Features to Look for in a Stock Report Template
When choosing or creating a stock report template, consider these essential features:
- Ticker Symbol: The unique identifier for each stock.
- Company Name: The name of the company whose stock you own.
- Purchase Date: The date you acquired the stock.
- Purchase Price: The price you paid per share.
- Number of Shares: The quantity of shares you own.
- Current Price: The latest market price of the stock. (Ideally, this should be automatically updated using Excel’s stock data feature.)
- Cost Basis: The total cost of your investment (number of shares * purchase price).
- Market Value: The current value of your investment (number of shares * current price).
- Gain/Loss: The difference between the market value and the cost basis.
- Percentage Gain/Loss: The percentage change in value, calculated as (gain/loss / cost basis) * 100.
- Dividends Received: A record of any dividends received for each stock.
- Transaction History: A log of all buys and sells, including dates, prices, and quantities.
- Portfolio Summary: A consolidated view of your total investment value, gains/losses, and asset allocation.
- Charts and Graphs: Visual representations of your portfolio performance over time. (optional but highly recommended)
Creating Your Own Stock Report Template in Excel
If you can’t find a template that perfectly meets your needs, consider creating your own. Here’s a basic outline:
- Open a new Excel spreadsheet.
- Define the headers: In the first row, enter the column headers as listed above (Ticker Symbol, Company Name, Purchase Date, etc.).
- Format the cells: Format columns like Purchase Price and Current Price as currency. Format Percentage Gain/Loss as a percentage.
- Enter your stock data: Fill in the rows with your investment information for each stock.
- Implement formulas:
- Cost Basis: `=Number of Shares * Purchase Price`
- Market Value: `=Number of Shares * Current Price`
- Gain/Loss: `=Market Value – Cost Basis`
- Percentage Gain/Loss: `=(Gain/Loss) / Cost Basis` (Format this cell as a percentage)
- Add data validation (optional): Use data validation to ensure that ticker symbols are entered correctly and to limit input errors.
- Create a Portfolio Summary: Calculate the total cost basis, market value, and overall gain/loss for your entire portfolio. Use the `SUM` function.
- Create Charts and Graphs (optional): Select your data and use Excel’s charting tools to visualize your portfolio performance.
Finding Free Stock Report Templates
Numerous websites offer free stock report templates for Excel. Here are a few places to start:
- Microsoft Office Templates: Search directly within Excel by going to File > New and searching for “stock portfolio” or “investment tracker.”
- Spreadsheet123.com: Provides a variety of free Excel templates, including stock portfolio trackers.
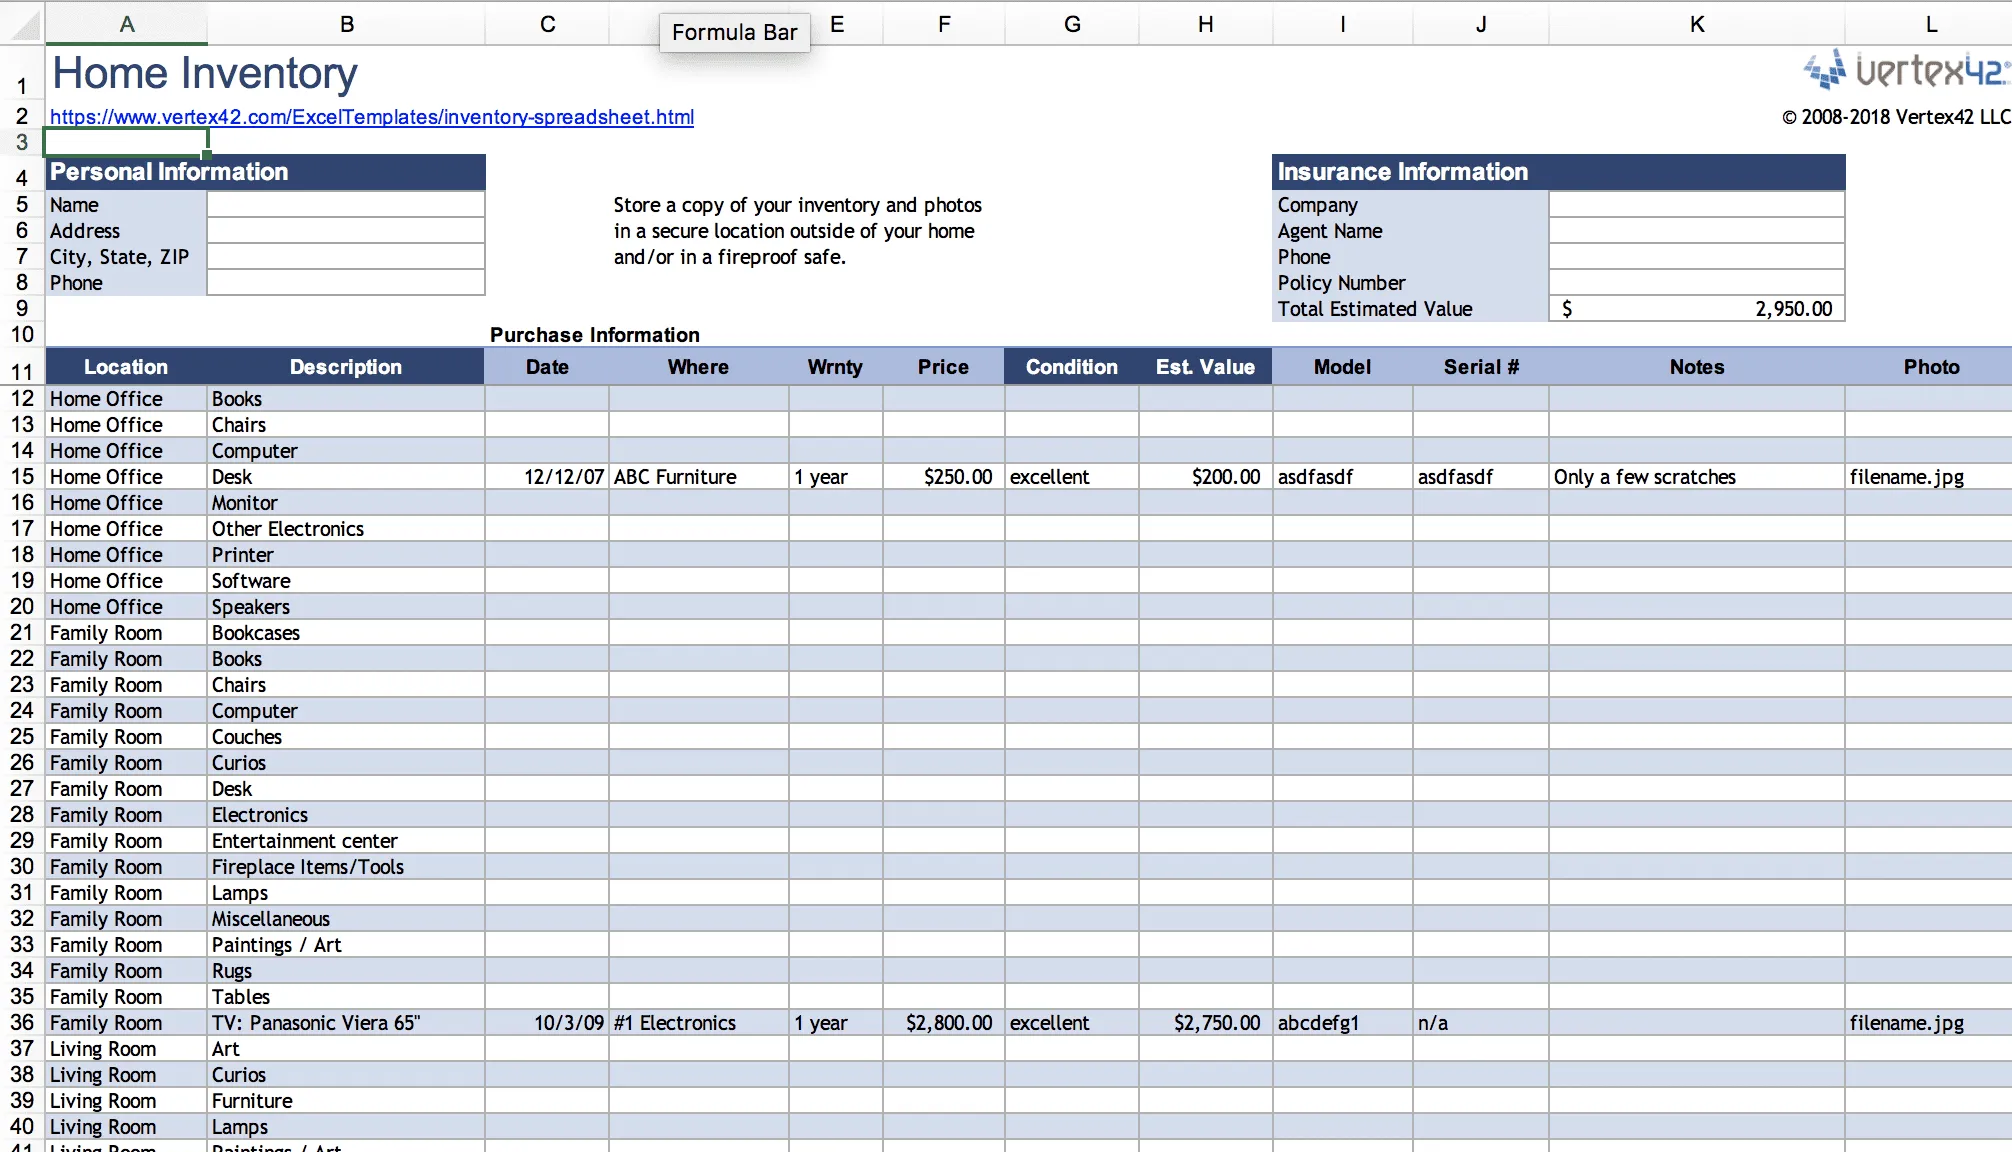
- Vertex42.com: Offers several financial templates, including options for tracking stocks and investments.
- Google Sheets Templates: If you prefer Google Sheets, search for “stock portfolio template” to find free, customizable options.
Before using any template, carefully review its features and ensure it meets your specific investment needs. Always verify the accuracy of any formulas or calculations within the template.
By leveraging a stock report template in Excel, you can gain a comprehensive understanding of your portfolio’s performance and make more informed investment decisions. Whether you choose a pre-built template or create your own, taking the time to track your investments effectively is a crucial step towards achieving your financial goals.
If you are searching about Stock Report Template Excel – Mightyprintingdeals.com you’ve came to the right page. We have 15 Pics about Stock Report Template Excel – Mightyprintingdeals.com like Inventory Spreadsheet Template Excel Product Tracking with Stock Report, Sales Forecast Spreadsheet Template 12 Month Free Example regarding and also Free Excel Inventory Templates: Create & Manage | Smartsheet intended. Here you go:
Stock Report Template Excel – Mightyprintingdeals.com
![]()
www.mightyprintingdeals.com
Spreadsheet Hotel Housekeeping Inventory Linen Sheet Luxury Inside
www.xfanzexpo.com
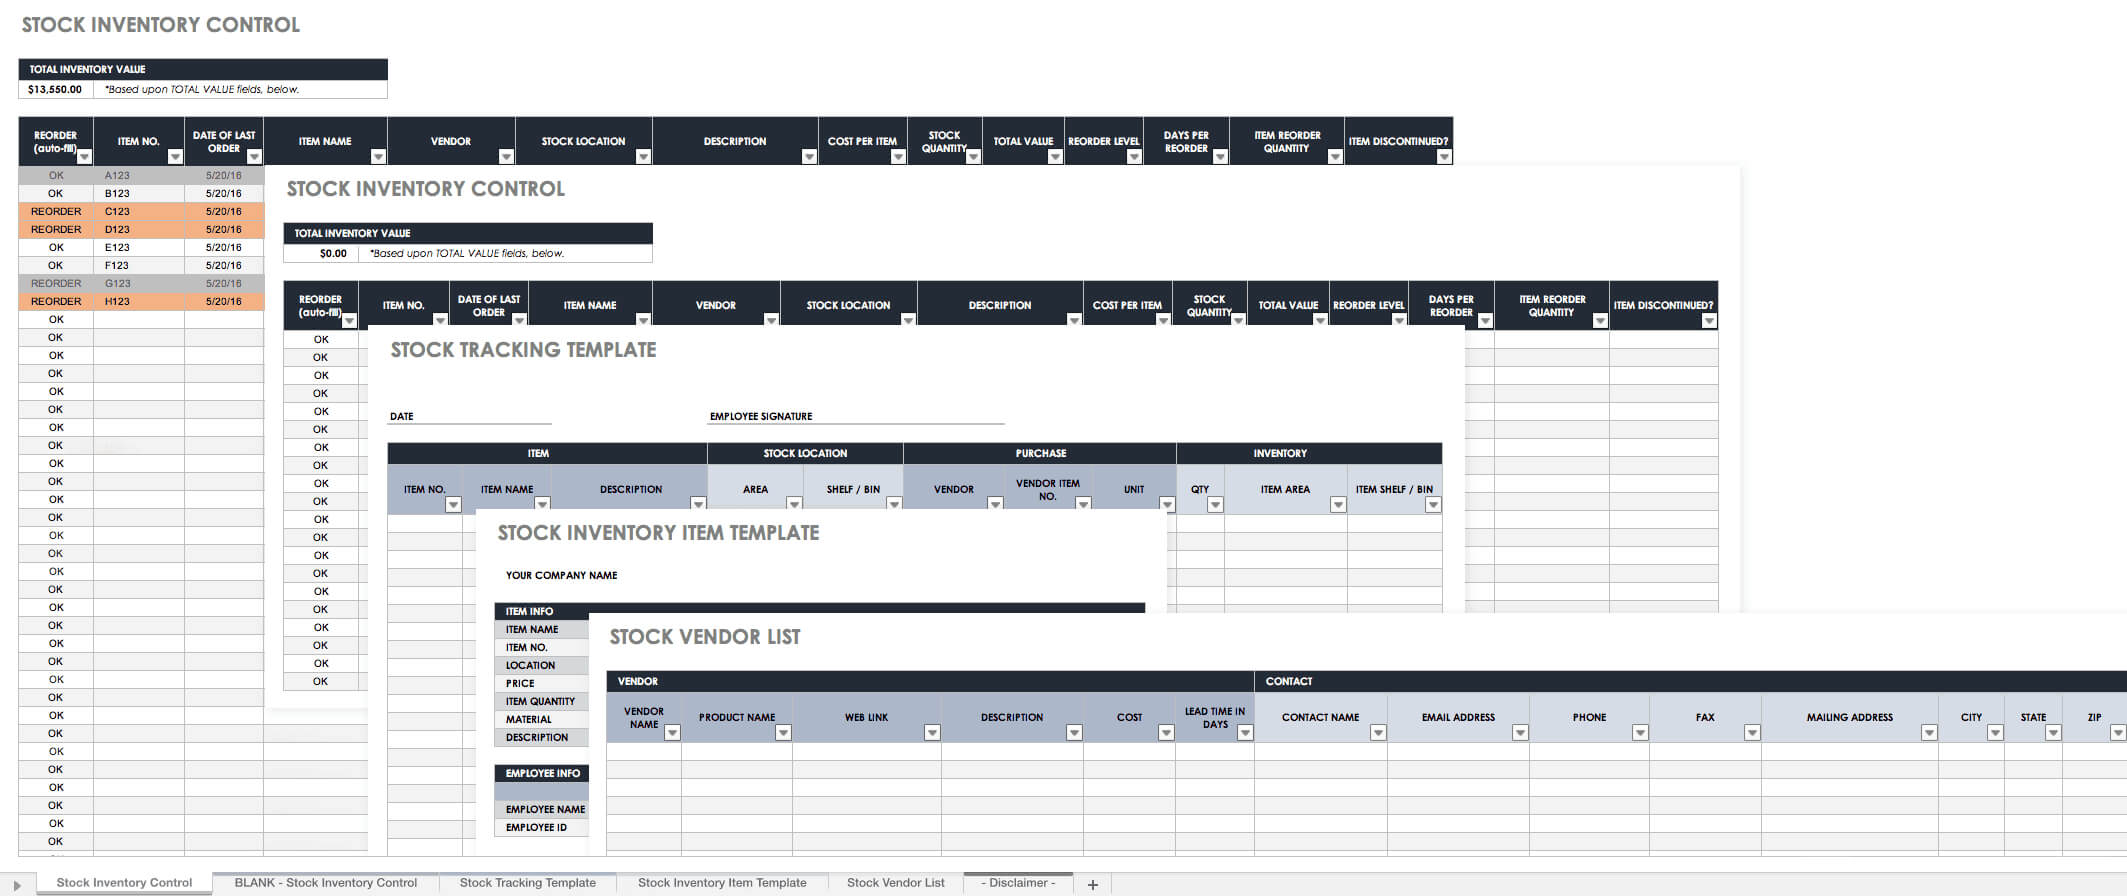
Top 10 Inventory Excel Tracking Templates – Sheetgo Blog Inside Stock
![]()
www.xfanzexpo.com
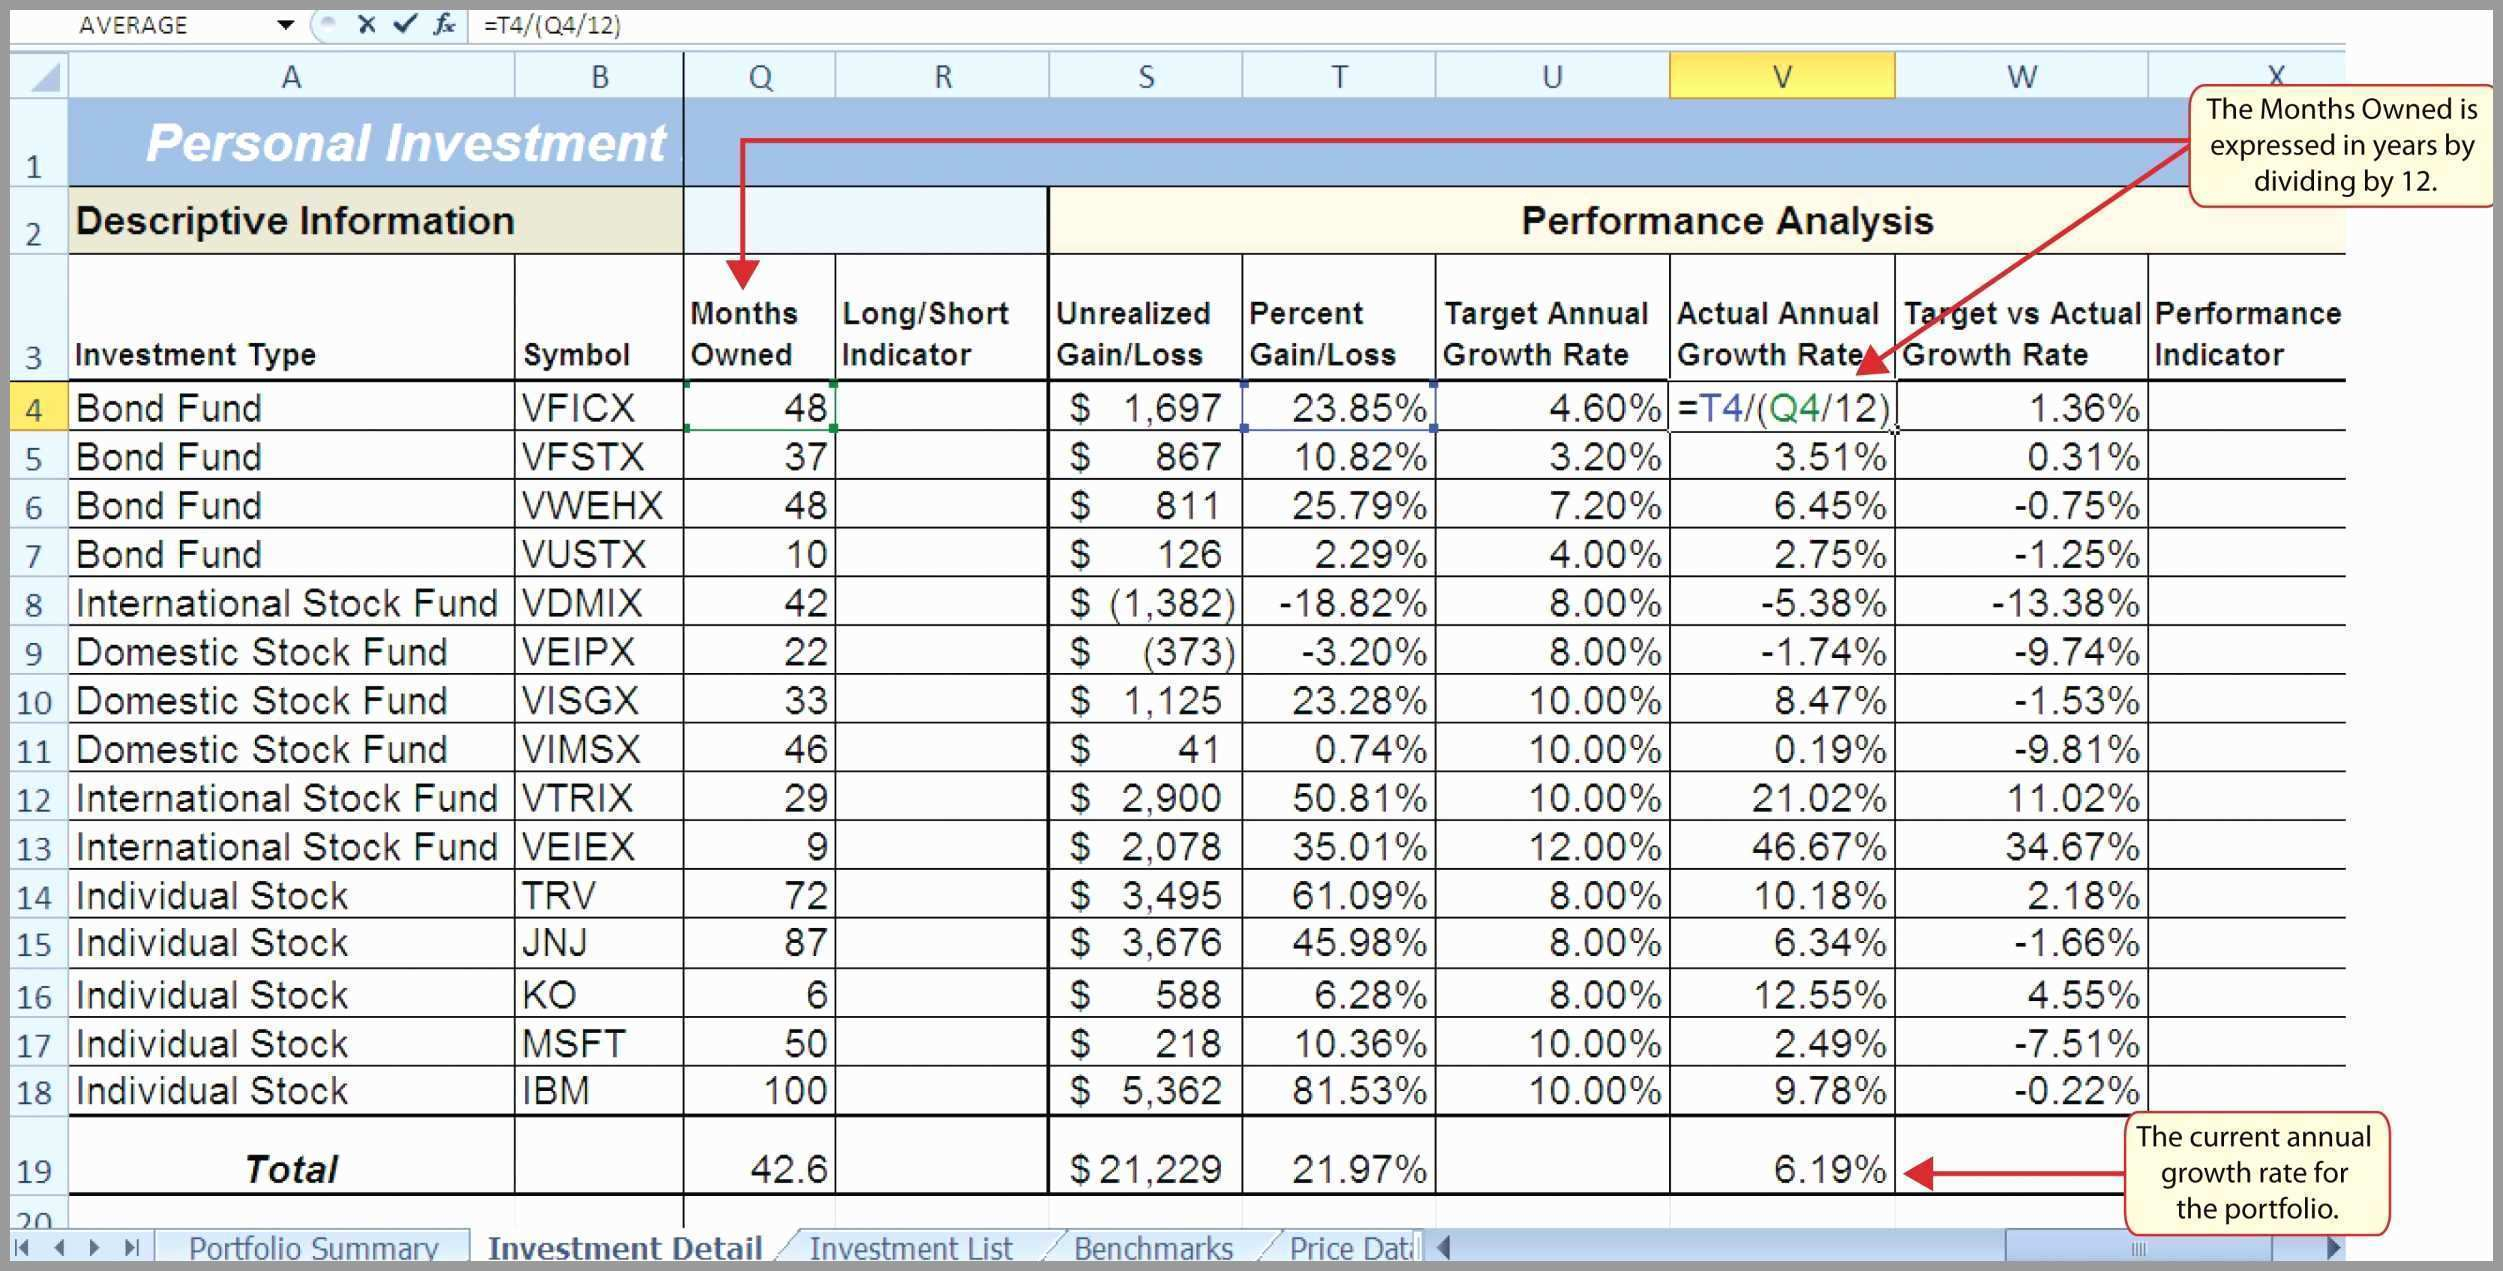
Sales Forecast Spreadsheet Template 12 Month Free Example Regarding
www.xfanzexpo.com
Free Excel Inventory Templates Create Manage Smartsheet With Stock
vancecountyfair.com
10 Stock Report Template Excel – Excel Templates – Excel Templates
www.exceltemplate123.us
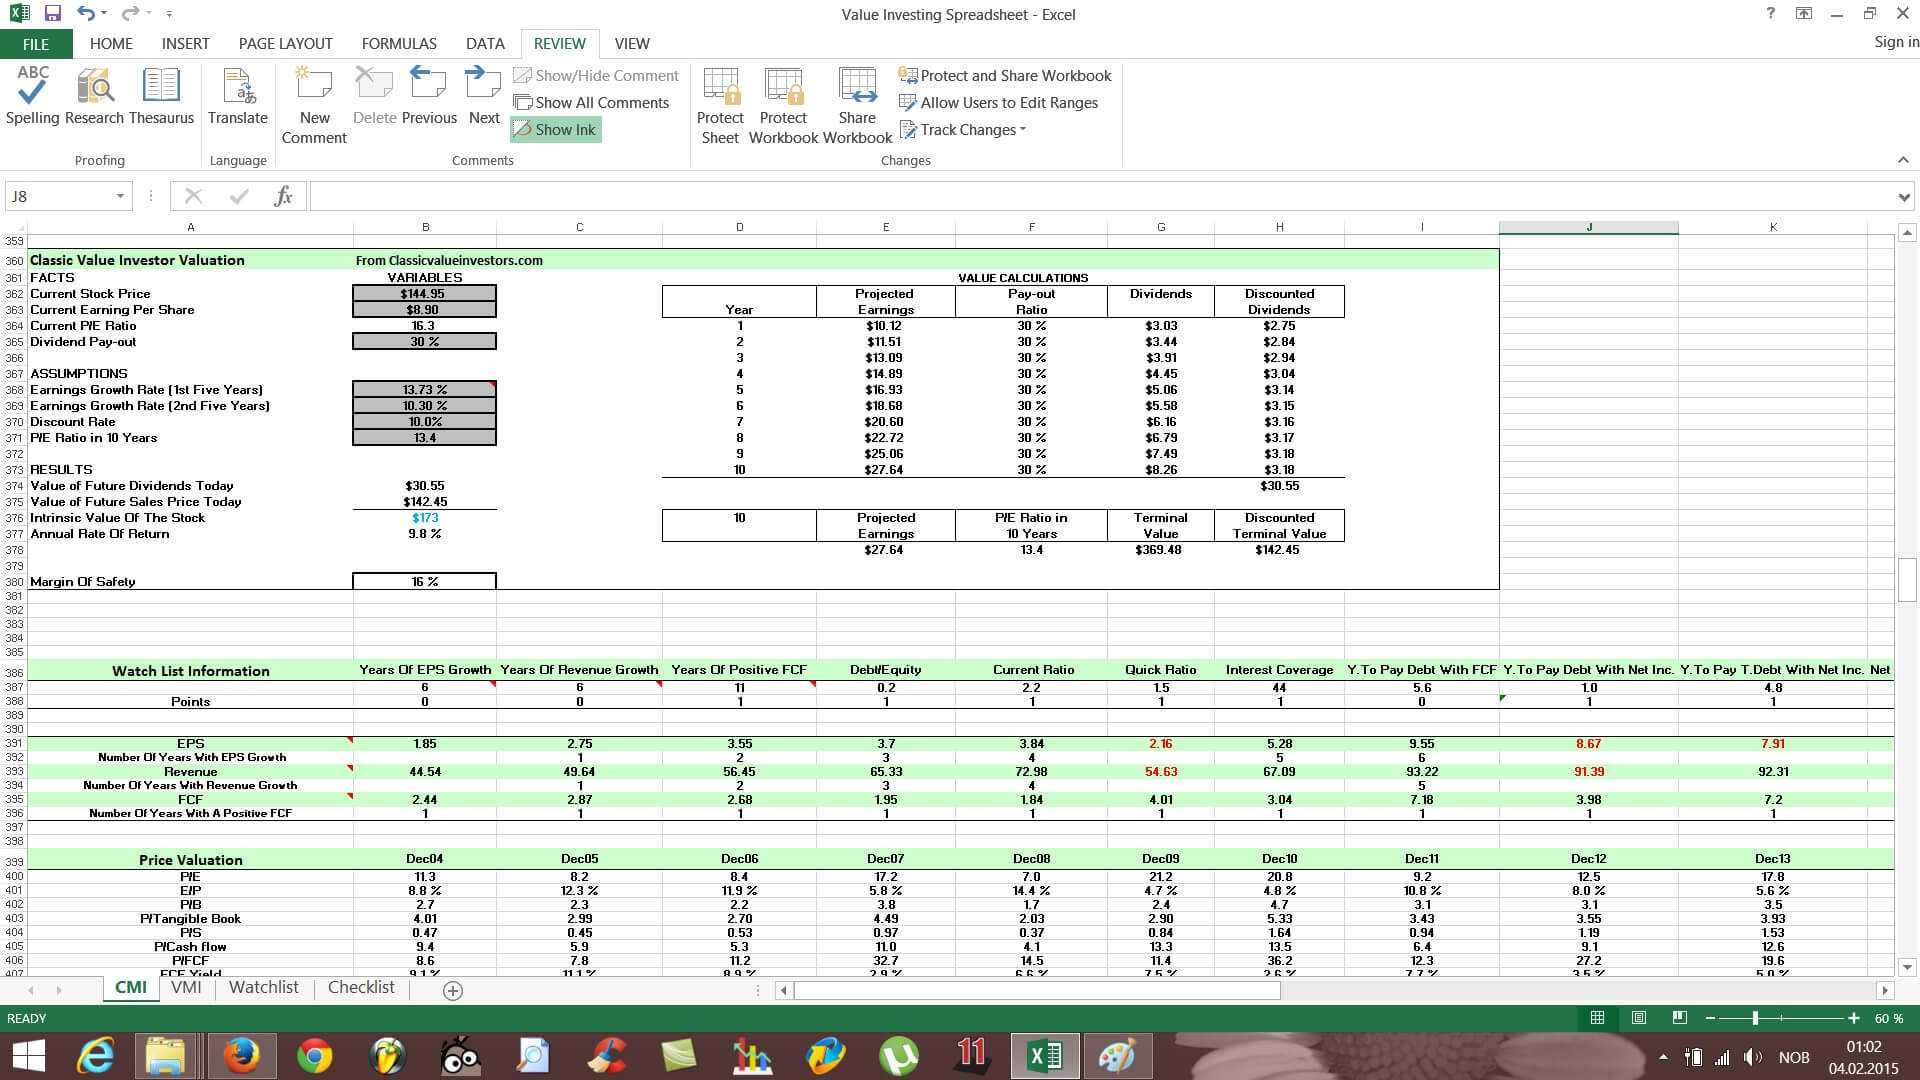
Stock Analysis Spreadsheet Excel Template Excel Spreadsheet Within
www.atlantaauctionco.com
10 Stock Report Template Excel – Excel Templates – Excel Templates

www.exceltemplate123.us
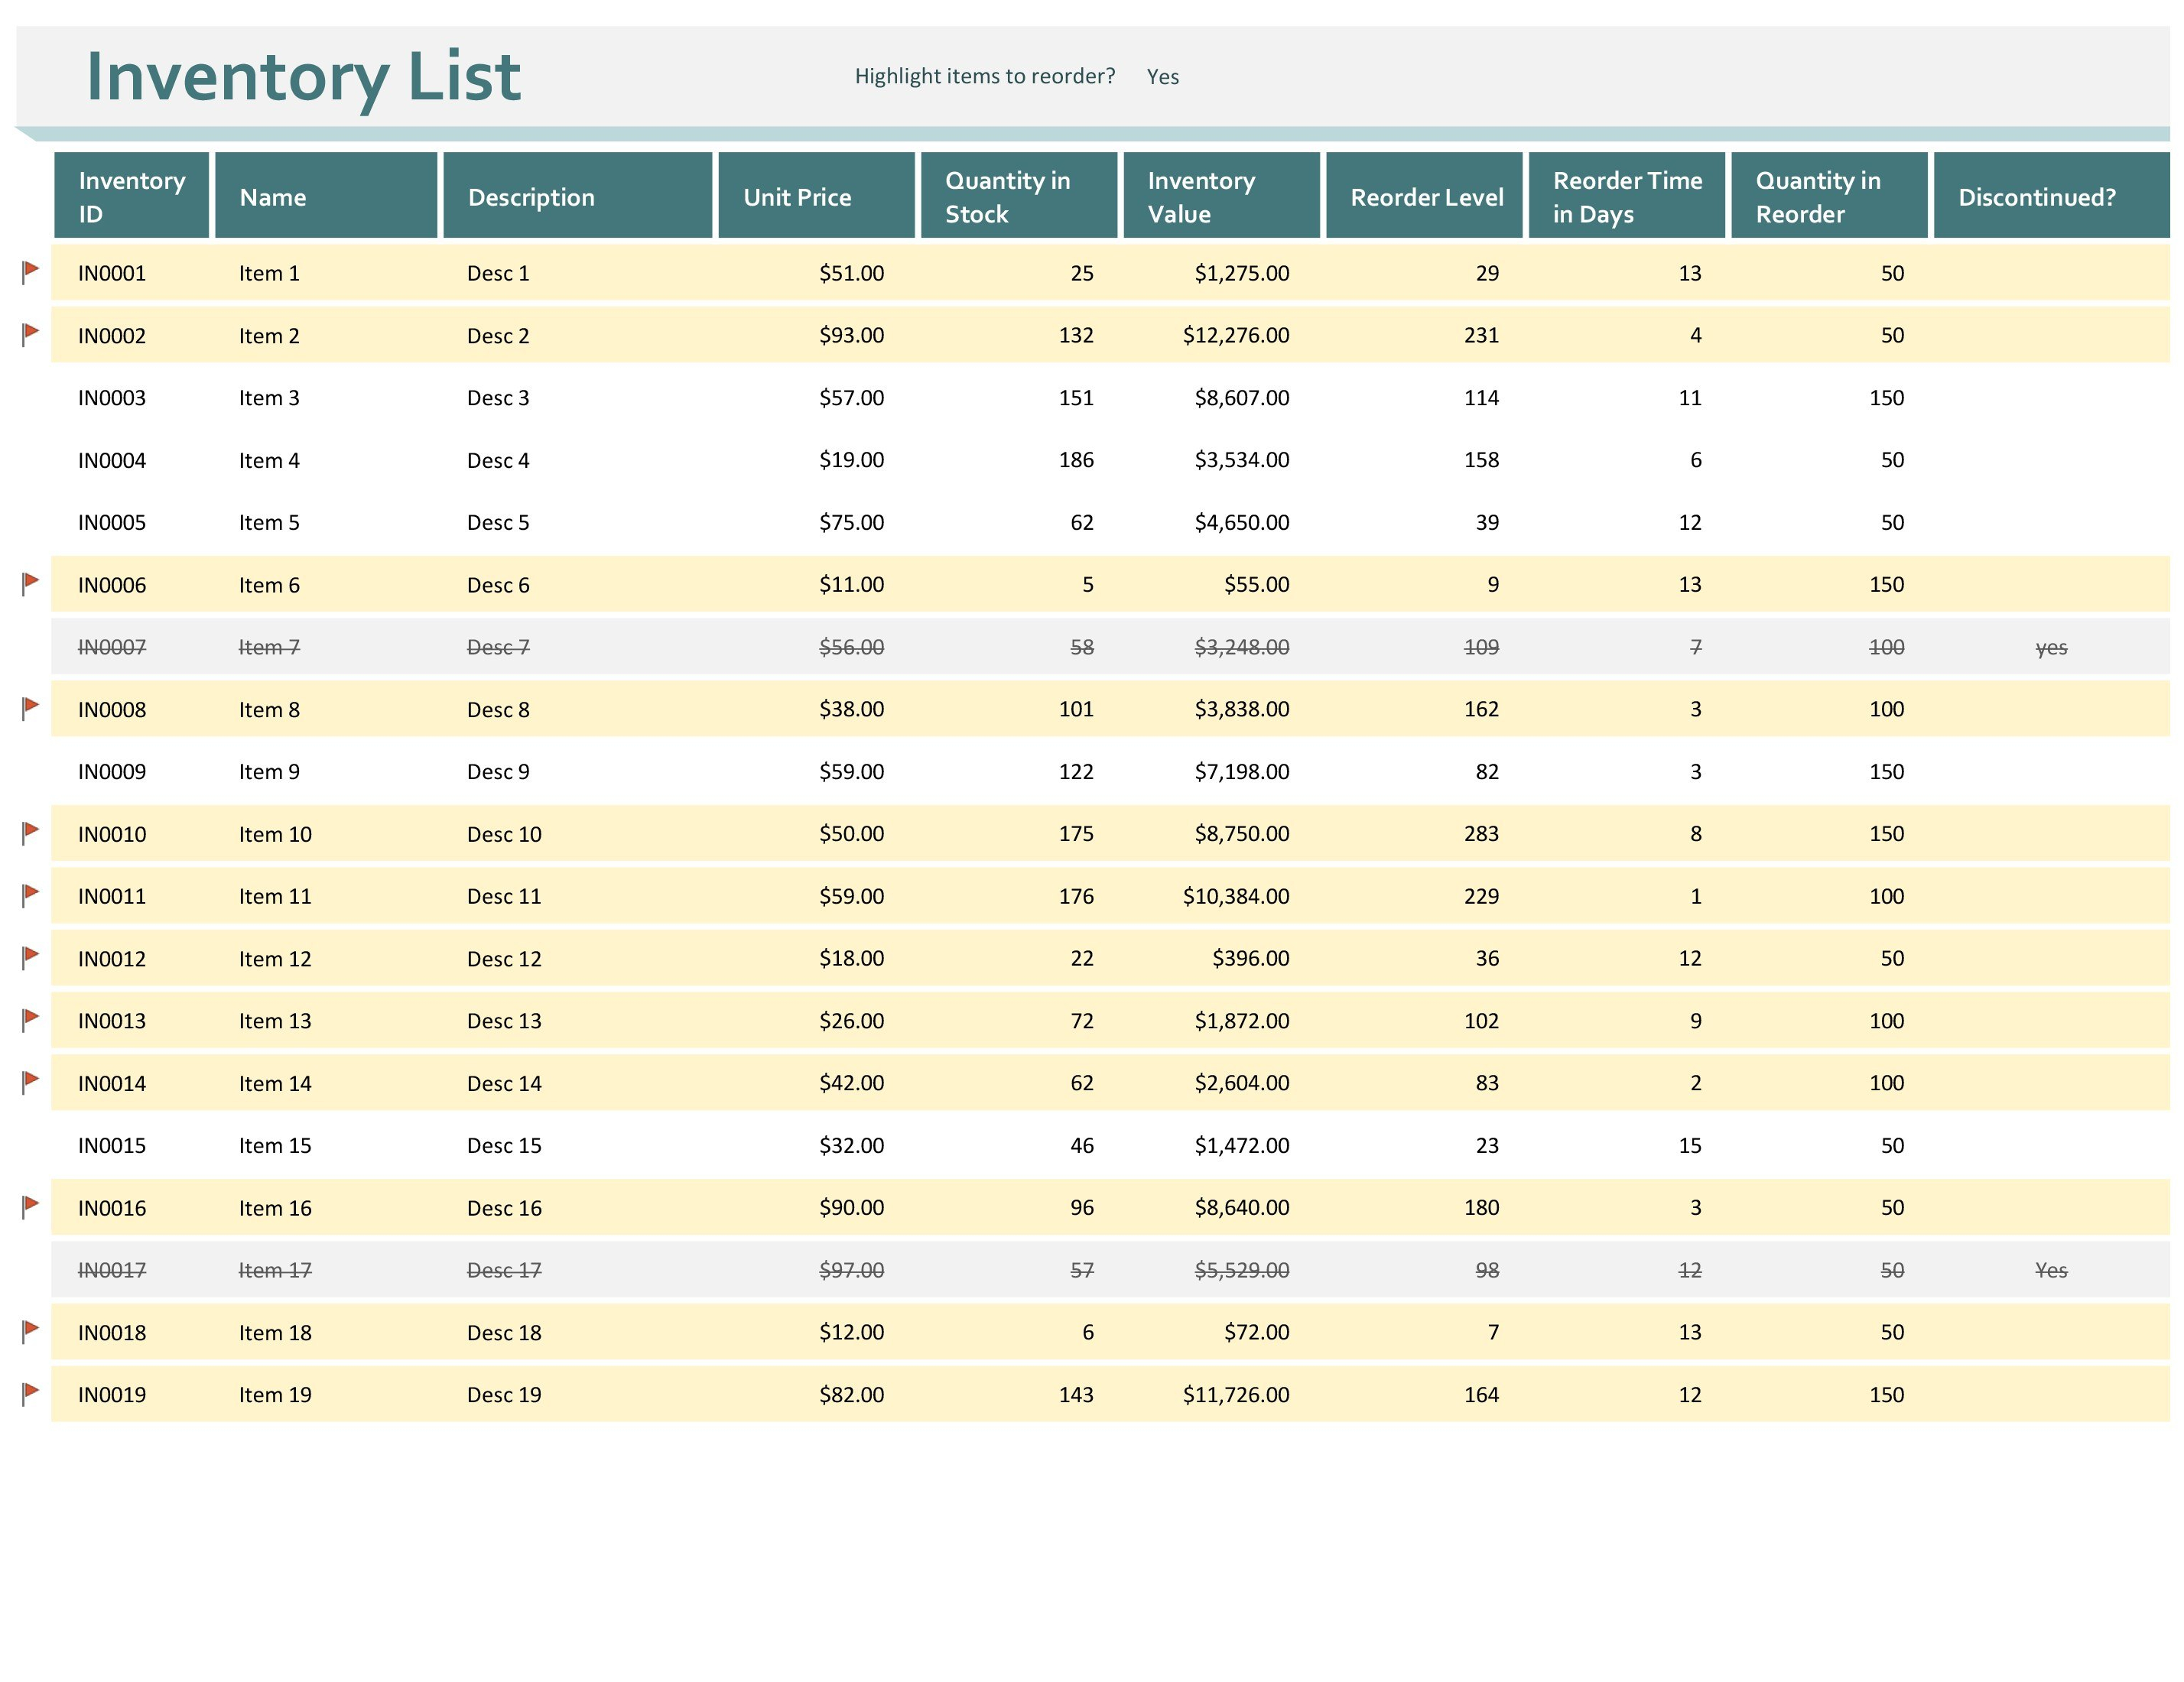
Inventory Spreadsheet Template Excel Product Tracking With Stock Report
![]()
www.xfanzexpo.com
Stock Report Template Excel – Mightyprintingdeals.com
www.mightyprintingdeals.com
Top 10 Inventory Excel Tracking Templates – Sheetgo Blog Pertaining To
![]()
www.xfanzexpo.com
Free Excel Inventory Templates: Create & Manage | Smartsheet Intended
pray.gelorailmu.com
Stock Analysis Spreadsheet Excel Template With Stock Analysis Excel
db-excel.com
Inventories Office Intended For Stock Report Template Excel – 10
vancecountyfair.com
Stock Report Template Excel – Mightyprintingdeals.com
www.mightyprintingdeals.com
Stock report template excel – mightyprintingdeals.com. Stock analysis spreadsheet excel template excel spreadsheet within. 10 stock report template excel